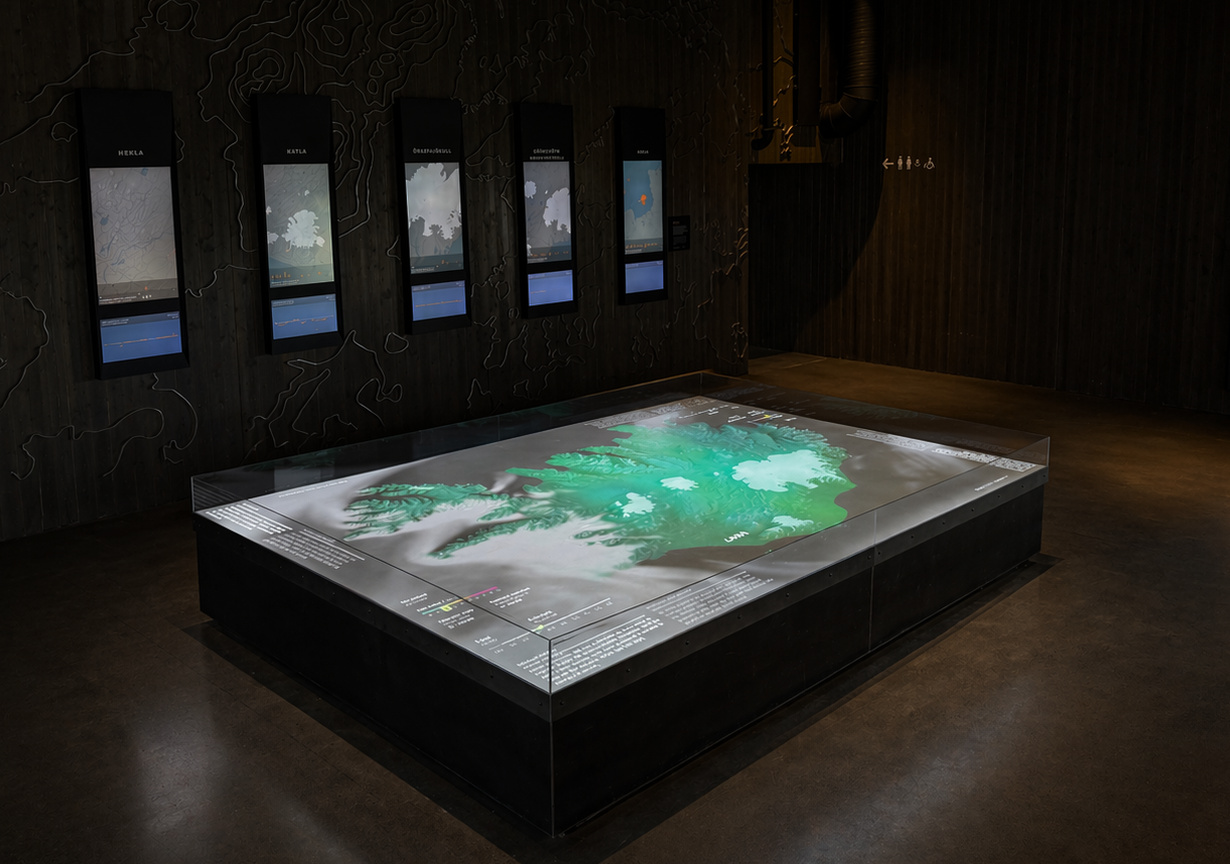
Located in South Iceland, LAVA Centre is an award-winning exhibition dedicated to Iceland’s volcanic and seismic activity. Through immersive installations and interactive media, the exhibition explores the powerful natural forces that shape the island, offering visitors insight into eruptions, earthquakes, and the ever-changing landscape. At the heart of the experience is the interactive table, which has been a central feature since opening. It brings together live data and visual storytelling, helping visitors understand what is happening in Iceland at any given moment.
Northern Lights
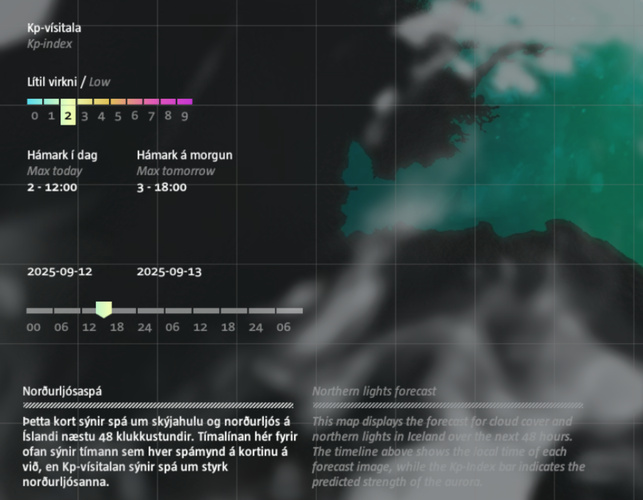
The table has now been updated with a new northern lights forecast layer that shows a real-time forecast for the next 48 hours. The map visualises both cloud cover and aurora activity across the country, while a timeline allows visitors to move through the forecast hour by hour. A built-in Kp index indicates the expected strength of the aurora, making it easier to understand when and where conditions are most favourable.
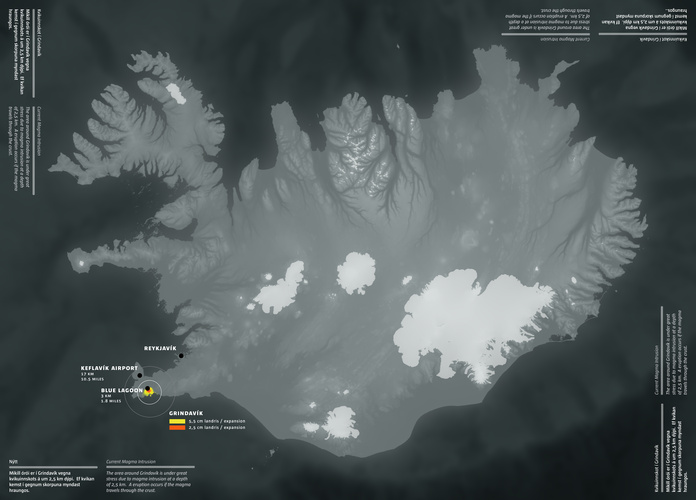
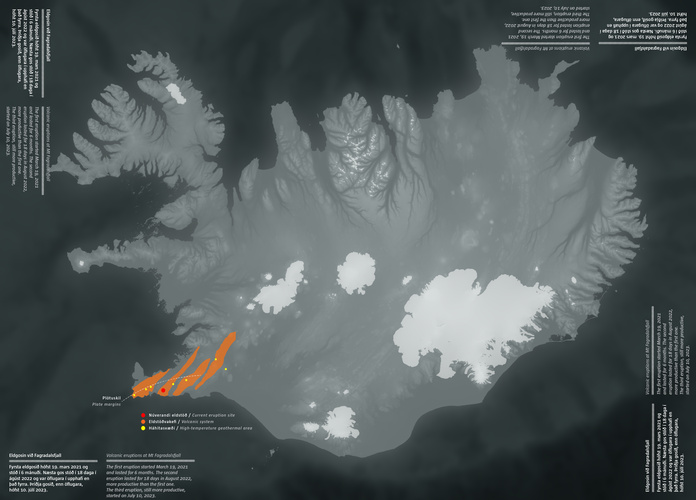
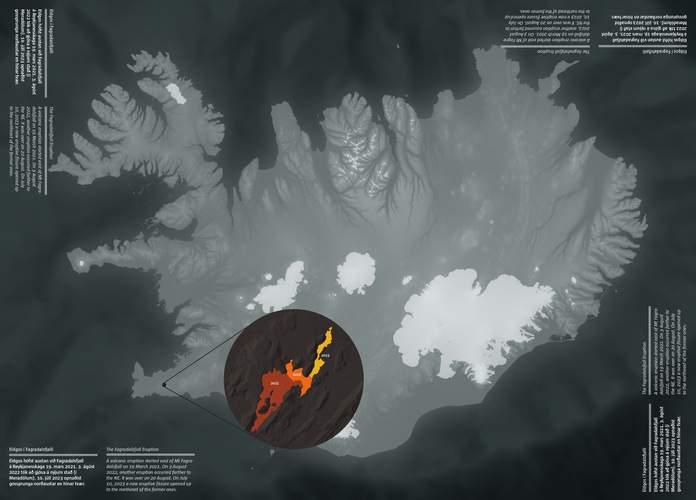
In addition to the Northern Lights update, the table continues to evolve with new real-time content. It now includes detailed visualisations of recent volcanic activity on the Reykjanes peninsula, including the eruptions near Grindavík. By integrating live data and spatial storytelling, the installation helps visitors understand the scale of the events, the development of protective barriers, and how these interventions function in response to ongoing activity.
It helps people understand the scale of the eruptions and how the protective barriers work, and we’ve seen strong feedback, especially from school groups Bárður Örn Gunnarsson, Managing Director at LAVA
This ability to respond quickly to current events has become an important part of the experience. School groups in particular have responded positively to how the exhibition reflects what is happening in Iceland right now, making complex geological processes more tangible and relevant.
The table also serves as a powerful tool for guides, who can navigate through the content, connect different datasets, and build narratives based on real-time events.
The exhibition design was made by Gagarin and Basalt Architects.